




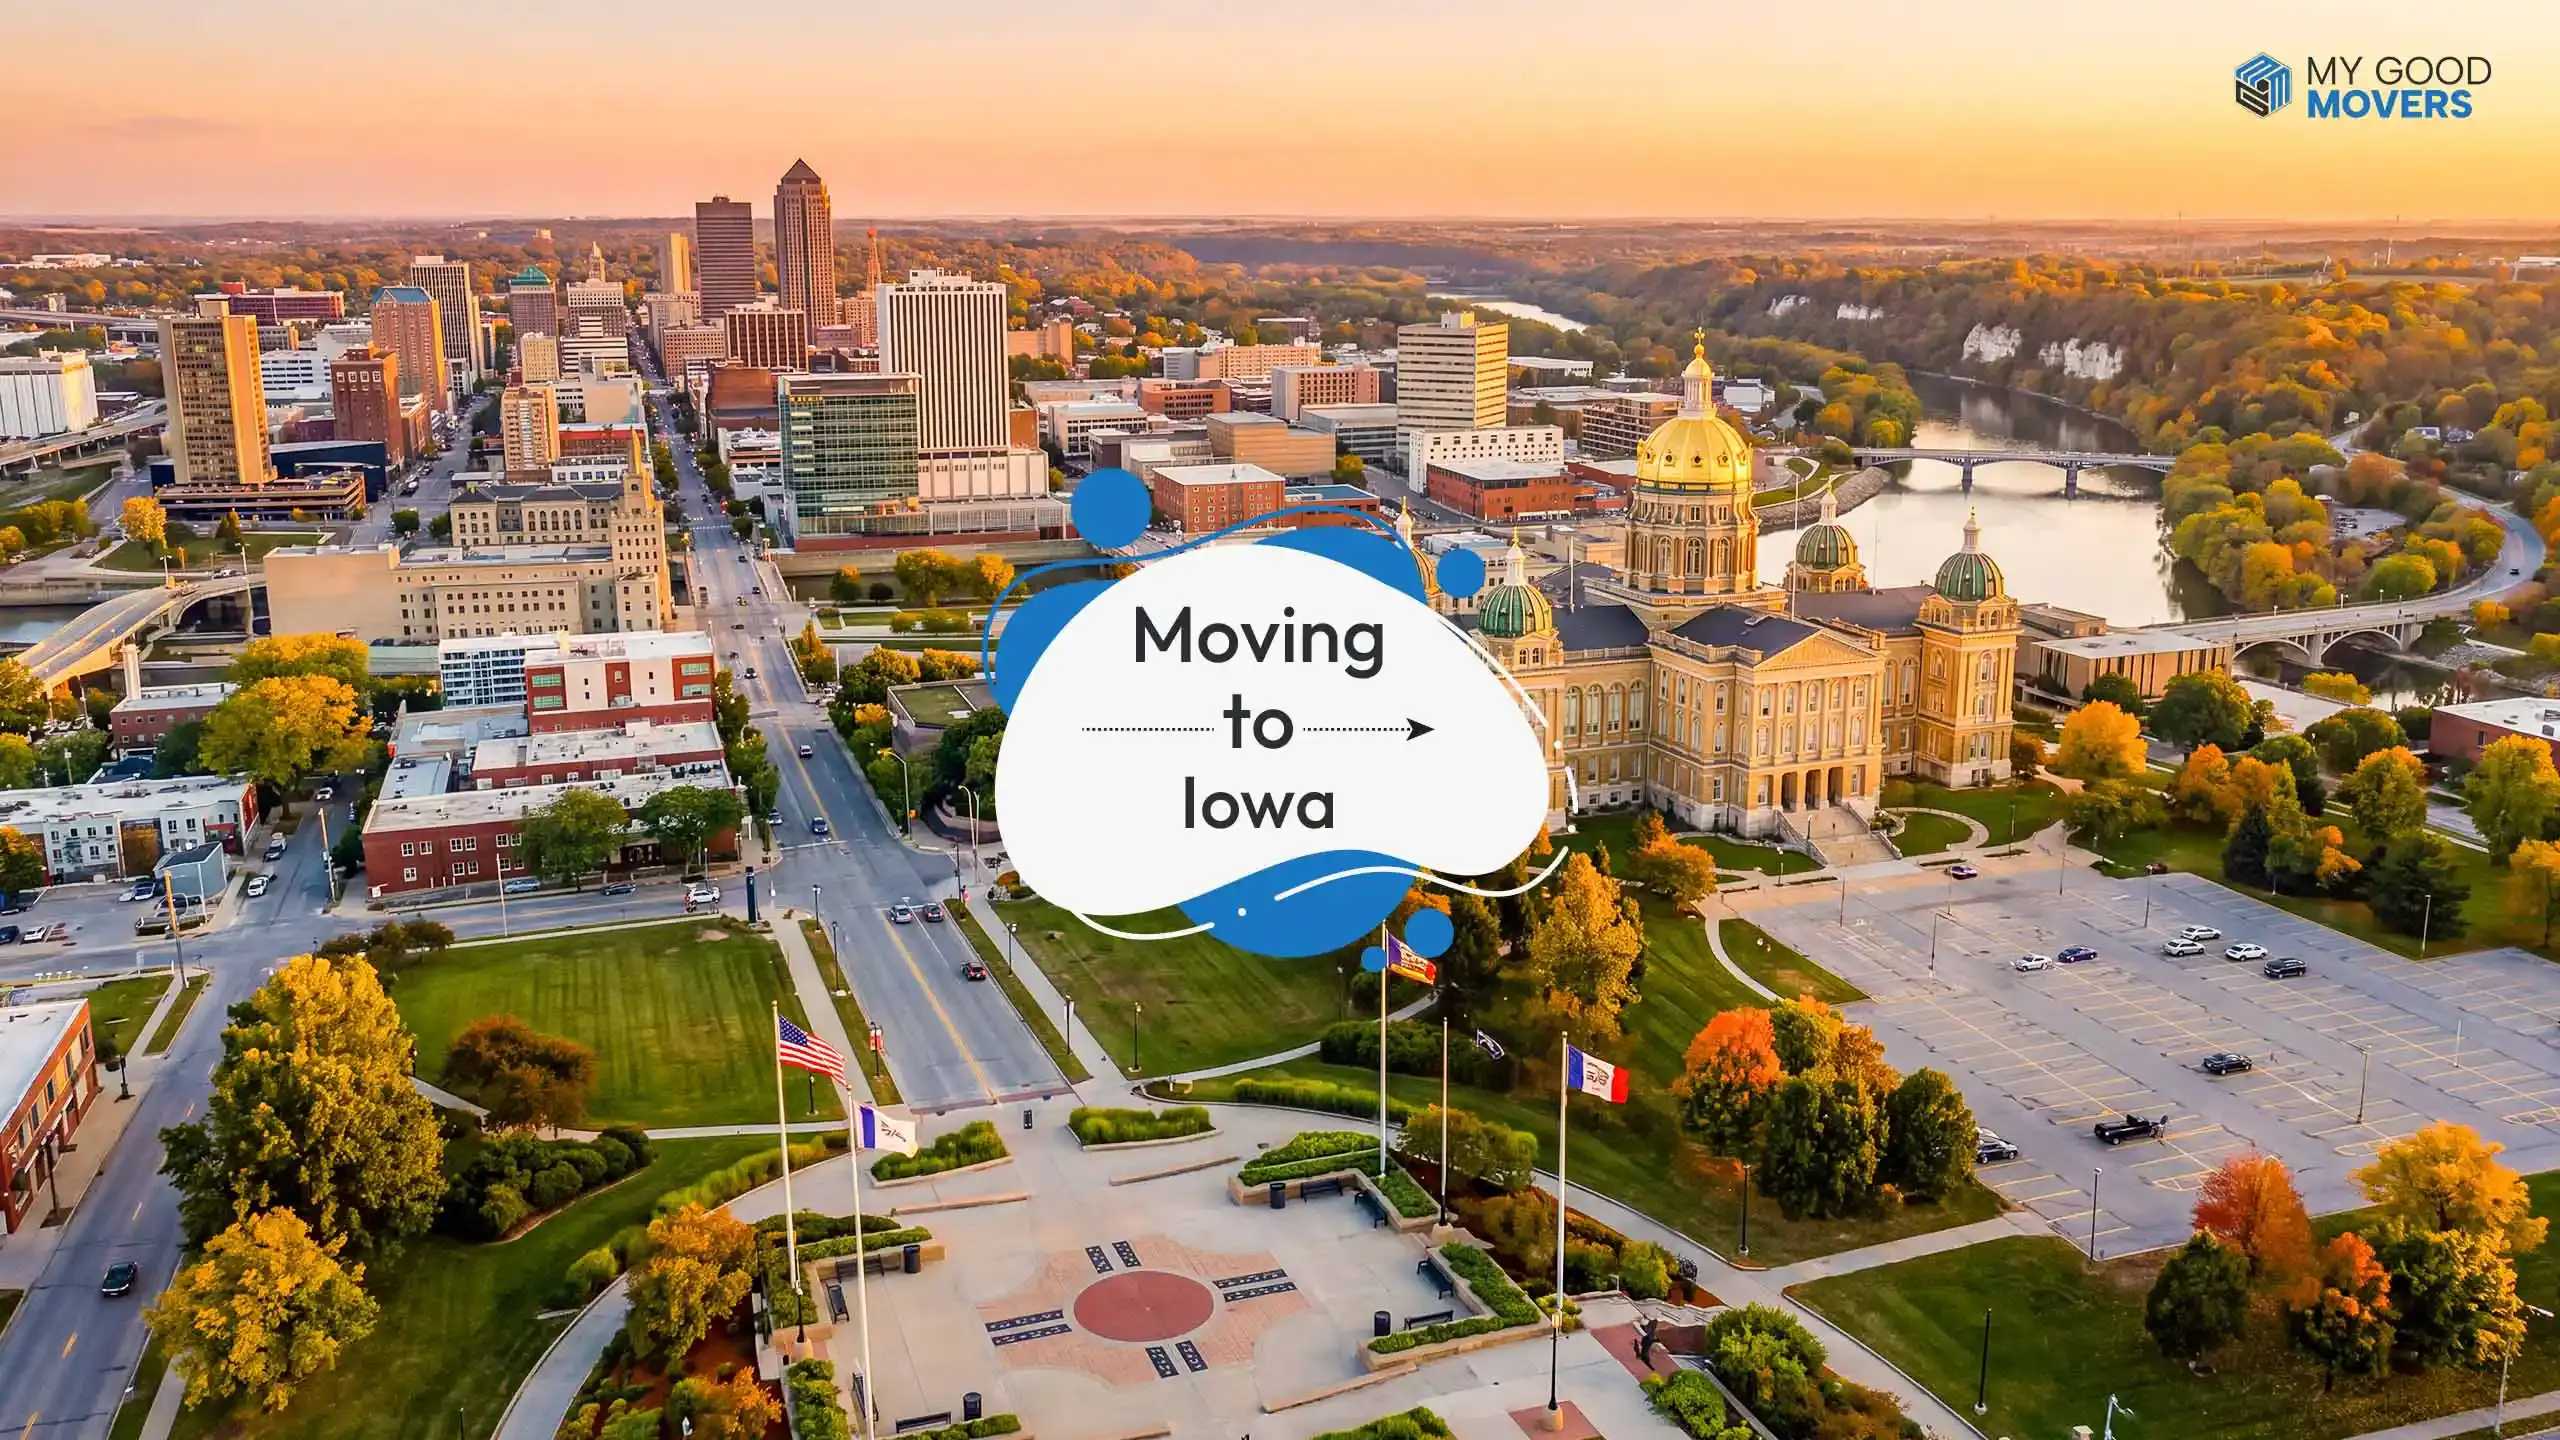
Iowa is worth considering in 2026 if you're looking for an affordable home, steady job opportunities, and a quieter place to settle down.
There's plenty to like about living in Iowa. Homes are more affordable than in many other states, traffic is lighter outside busy areas, and industries like healthcare, manufacturing, and finance offer job opportunities.
But life here also comes with freezing winters, severe storms, property taxes, and limited public transportation in smaller communities.
So before you move to another state, take a closer look at Iowa's living expenses, local job market, and the differences between its cities and smaller towns.
And if you are still wondering where to move in the USA, let’s compare your options and see how Iowa fits the lifestyle, career opportunities, and everyday comforts you're looking for.
- Moving to Iowa at a Glance
- Iowa Relocation Quick Facts
- Pros and Cons of Living in Iowa
- Iowa Population and Migration Trends
- Best Places to Live in Iowa
- Compare Iowa's Major Cities
- Cost of Living in Iowa
- Taxes and Insurance in Iowa
- Where Are the Best Job Opportunities in Iowa?
- Crime and Safety in Iowa
- Iowa Weather and Climate
- Healthcare in Iowa
- Schools and Colleges in Iowa
- Transportation and Commuting in Iowa
- Is Iowa Right for Your Situation?
- How Much Does It Cost to Move to Iowa?
- Best Moving Companies for Your Move to Iowa
- FAQs
- Our Research and Data Process
Moving to Iowa at a Glance
Is Iowa a Good Place to Live?
Yes, Iowa is a good place to live for affordable housing, quieter communities, and a slower pace of life. The state also has established healthcare, manufacturing, and agricultural industries.
Is Moving to Iowa Worth It?
Yes, moving to Iowa is worth it for people seeking lower housing costs and long-term stability. However, property taxes, winter heating bills, and transportation expenses affect overall affordability.
Who Is Iowa Best Suited For?
Iowa suits first-time homebuyers, families seeking more space, retirees who prefer peaceful surroundings, and professionals working in the state's major industries.
Who May Not Enjoy Living in Iowa?
People who dislike freezing winters, humid summers, and severe storms might not enjoy Iowa. Those who depend on public transportation or prefer an active nightlife might also find it less appealing.
Iowa Relocation Quick Facts
| Category | Iowa Quick Facts |
|---|---|
| Capital | Des Moines |
| Largest Cities | Des Moines, Cedar Rapids, Davenport, Sioux City, Iowa City, Waterloo |
| Population | 3.24 million |
| Population Growth | +1.5% since 2020 |
| Time Zone | Central Time (CT) |
| Climate Type | Humid Continental |
| Average Living Costs | $36,856/year (single adult, after taxes) |
| Home Prices | $236,623 |
| Average Rent | $1,100/month |
| Median Household Income | $76,483/year |
| State Income Tax | 3.8% flat rate |
| State Sales Tax | 6% statewide (up to 7% with local tax) |
| Property Tax | 1.33% average effective rate |
Pros and Cons of Living in Iowa
Pros
- Strong employment base in manufacturing, healthcare, logistics, and education.
- Home prices and rents are lower than national benchmarks.
- Access to state parks, lakes, and forests.
- Central Midwest location with major interstate highway connections.
- Major universities, including Purdue University and Indiana University.
- Different living environments, from established suburbs to small rural towns.
- Indiana's property tax caps limit qualifying property tax bills.
Cons
- Specialized career opportunities are less available in rural communities.
- County income taxes add to the statewide income tax.
- Cold winters bring snow, ice, and higher heating expenses.
- Most communities require a car for work, shopping, and everyday errands.
- Severe thunderstorms, tornadoes, and flooding create seasonal risks.
- Healthcare specialists and major medical facilities are less accessible in some rural areas.
- Homeowners insurance, property taxes, and maintenance increase ownership expenses.
Iowa Population and Migration Trends
Iowa's population has grown steadily since 2020, though some counties are growing faster than others. These population trends show which areas are attracting new residents and where people are moving from.
How Many People Live in Iowa?
Best Places to Live in Iowa
The right place to live in Iowa depends on your job, family needs, and preferred lifestyle.
Des Moines
Iowa's capital has plenty of jobs in finance and insurance, major hospitals, and a growing downtown. About 212,100 people live here.
West Des Moines
People choose West Des Moines for its well-developed neighborhoods, good schools, and easy access to jobs and shopping. The median household income is $86,594.
Ankeny
Families like Ankeny for its newer homes, good schools, and nearby Des Moines jobs. The median household income is $108,198.
Cedar Rapids
Cedar Rapids is a good choice for people who want lower home prices and jobs in manufacturing and healthcare without living in a large city.
Iowa City
The University of Iowa brings jobs and medical services to Iowa City, while its downtown offers restaurants, shops, and activities throughout the year.
Ames
Ames is a good place for people who prefer a smaller city with university jobs, a friendly community, and convenient public transport.
Compare Iowa's Major Cities
| City | Population | Growth | Monthly Living Cost | Median Home Price | Average Rent | Average Salary |
|---|---|---|---|---|---|---|
| Des Moines | 212.1K | -0.9% | $1,900 | $241.8K | $1,050 | $44,208 |
| Cedar Rapids | 137.9K | +0.1% | $1,672 | $284.9K | $2,125 | $43,608 |
| Davenport | 100.4K | -1.3% | $1,752 | $225K | $1,000 | $45,492 |
| Iowa City | 76.2K | +1.9% | $1,941 | $344.9K | $1,612 | $43,848 |
| Ankeny | 77.8K | +14.3% | $1,819 | $365K | $1,250 | $63,744 |
| West Des Moines | 74.2K | +8.0% | $1,972 | $343.5K | $2,125 | $47,952 |
| Ames | 68.2K | +2.7% | $1,811 | $369K | $1,400 | $43,380 |
| Dubuque | 59.1K | -0.9% | $1,574 | $299K | $1,150 | $45,216 |
Cost of Living in Iowa
Iowa is cheaper than the national average, but your spending still depends on your household size and everyday needs.
Housing Costs
Homes in Iowa cost less than the national average, though prices keep rising. Buyers still have to think beyond the sale price.
Housing is Iowa's biggest advantage.
Average home values in Iowa are 35.4% lower than the national average, while rents are 43% lower. Residential electricity rates are also below the U.S. average, although winter heating adds to household expenses.
| Housing Expense | Latest Cost |
|---|---|
| Typical home value | $236,623 |
| Median sale price | $246,167 |
Everyday Monthly Costs
Iowa vs. the U.S. Average
Taxes and Insurance in Iowa
Iowa has lowered its income tax rate, but property taxes and home insurance still take a noticeable share of a household's budget.
| Expense | Current Rate or Cost |
|---|---|
| State income tax | 3.8% flat rate (2026) |
| State sales tax | 6% |
| Average combined state + local sales tax | 6.94% |
| State grocery tax | 0% on qualifying groceries |
| Effective property tax rate | 1.33% |
| Homeowners insurance | $291/month |
| Flood insurance | $76/month |
Iowa's Overall Tax Burden Compared With Nearby States
Tax burden shows how much of residents' income goes toward state and local taxes, including property, income, sales, and excise taxes.
| State | Overall Tax Burden | Property | Income | Sales & Excise | Difference vs. Iowa | Per $100K Income |
|---|---|---|---|---|---|---|
| Iowa | 9.21% | 3.32% | 2.36% | 3.53% | Baseline | Baseline |
| Illinois | 9.92% | 3.75% | 2.40% | 3.77% | +0.71 pts | +$710 |
| Minnesota | 9.08% | 2.47% | 3.34% | 3.27% | -0.13 pts | -$130 |
| Nebraska | 8.16% | 3.22% | 2.11% | 2.82% | -1.05 pts | -$1,050 |
| Wisconsin | 8.12% | 2.84% | 2.39% | 2.89% | -1.09 pts | -$1,090 |
| Missouri | 7.84% | 2.35% | 2.38% | 3.11% | -1.37 pts | -$1,370 |
| South Dakota | 6.38% | 3.25% | 0.00% | 3.13% | -2.83 pts | -$2,830 |
How Expensive Is It to Live in Iowa?
Iowa is generally more affordable than many other states, but the amount you need to cover everyday expenses depends on your household size and where you choose to live.
| Household | Living Wage | Basic Monthly Budget | Annual Income Before Taxes |
|---|---|---|---|
| Single adult | $21.29/hour | $3,071 | $44,273 |
| Couple, both working | $14.55/hour each | $4,392 | $60,514 combined |
| Family of four, two working parents | $24.57/hour each | $7,432 | $102,199 combined |
Where Are the Best Job Opportunities in Iowa?
Healthcare is one of Iowa's busiest hiring sectors. Finance, manufacturing, and engineering also offer established career paths statewide.
Iowa's Top Career Hubs
Top career hubs by pay. Average annual earnings across Iowa's major employment centers.
| City | Leading Industries | Average Annual Pay |
|---|---|---|
| Des Moines | Finance, insurance, government | $65,978 |
| Iowa City | Healthcare, education, research | $65,416 |
| Ames | Engineering, agricultural research | $61,922 |
| Cedar Rapids | Aerospace, manufacturing | $60,715 |
| Dubuque | Manufacturing, logistics | $60,362 |
Which City Fits Your Career?
| City | When You Work In | Common Jobs |
|---|---|---|
| Des Moines | Insurance, banking, finance, or government | Financial analyst, insurance underwriter, accountant |
| Iowa City | Healthcare, medical research, or education | Registered nurse, medical researcher, university instructor |
| Ames | Engineering, biotechnology, or agricultural research | Agricultural engineer, research scientist, software developer |
| Cedar Rapids | Aerospace, electronics, or food manufacturing | Aerospace engineer, electronics technician, production supervisor |
| Dubuque | Heavy equipment manufacturing, logistics, or healthcare | Mechanical engineer, CNC machinist, logistics coordinator |
Crime and Safety in Iowa
Iowa has lower violent and property crime rates than the national average, with both continuing to decline.
Is Iowa a Safe Place to Live?
Yes, Iowa is generally a safe state to live in, with crime rates below national levels. In 2025, Iowa recorded 238.2 violent crimes and 1,197.8 property crimes per 100,000 residents, both lower than in 2023.
Iowa Violent and Property Crime Trends
Iowa has seen a steady drop in violent and property crime since 2023, with fewer robberies, burglaries, and homicides reported across the state.
| Crime Measure | 2025 Rate per 100K | Change From 2023 | Compared With U.S. |
|---|---|---|---|
| Violent crime | 238.2 | -15.5% | Lower |
| Property crime | 1,197.8 | -12.6% | Lower |
| Overall crime | 1,436.0 | -13.1% | Lower |
| Murder | 1.7 | -34.6% | Lower |
| Robbery | 15.9 | -32.3% | Lower |
| Burglary | 173.2 | -17.0% | Lower |
Safest Cities and Communities in Iowa
| Community | Violent Crime per 100K | Property Crime per 100K | Recent Trend |
|---|---|---|---|
| Carroll | 39.5 | 978.5 | Violent crime down 66.6% |
| North Liberty | 69.3 | 397.5 | Violent crime down 39.4%; property crime up 42.5% |
| Johnston | 76.6 | 749.4 | Violent crime rate down 1.1% since 2020 |
| Urbandale | 89.1 | 634.6 | Violent crime down 28.7% |
| Marion | 122.6 | 497.4 | Violent crime down 45.8%; property crime down 27% |
Road Safety and Traffic Fatalities
Iowa recorded its lowest number of traffic deaths in 2025, down 27% from 2024.
Iowa Weather and Climate
Iowa has four distinct seasons, with freezing winters, warm and humid summers, and changing temperatures in spring and fall.
Warming & Stormy
Temperatures rise, bringing frequent rain, thunderstorms, and tornado risks.
Warm & Humid
Daytime highs usually reach 80–85°F, with humid conditions and occasional heat waves.
Cool & Crisp
Warm afternoons turn into chilly evenings, with falling temperatures and occasional early snowfall.
Freezing & Snowy
Temperatures often drop below 20°F, with snowstorms, icy roads, and bitter wind chills.
What Else to Expect
| Weather Period | Typical Conditions | What to Expect |
|---|---|---|
| Snow | Common throughout winter | 20–40 inches annually |
| Rainfall | 32.6 inches annually | Most rain falls during warmer seasons. |
| Thunderstorms | Frequent in spring and summer | Heavy rain, hail, lightning, and strong winds. |
| Tornado season | Peaks in late spring and early summer | Highest activity in May and June. |
| Flooding risk | Near rivers and low-lying areas | Heavy rainfall and snowmelt cause flooding. |
Which Parts of Iowa Face the Greatest Weather Risks?
- Northern Iowa faces colder winters, heavier snowfall, and longer periods of icy conditions.
- Central and western Iowa face severe thunderstorms, tornadoes, hail, and damaging straight-line winds.
- Eastern and southeastern Iowa have greater rainfall and river-flooding concerns, especially along the Mississippi River and its tributaries.
Healthcare in Iowa
Iowa's strongest healthcare services are found in Iowa City, Cedar Rapids, Des Moines, Ames, and Dubuque, where major hospitals provide specialist treatment and emergency care.
Best Hospitals and Medical Centers
The 2026 Newsweek and Statista Best-in-State Hospitals rankings recognize 20 Iowa hospitals.
| Rank | Hospital | City | Key Strength |
|---|---|---|---|
| #1 | UnityPoint Health–St. Luke's Hospital | Cedar Rapids | Heart care and surgical services |
| #2 | University of Iowa Health Care Medical Center | Iowa City | Advanced cancer and specialty care |
| #3 | MercyOne Dubuque Medical Center | Dubuque | Cardiac and surgical care |
| #4 | Mercy Medical Center | Cedar Rapids | Cancer treatment and general surgery |
| #5 | Mary Greeley Medical Center | Ames | Cancer care and rehabilitation |
| #6 | MercyOne Des Moines Medical Center | Des Moines | Heart care and emergency services |
Rural Healthcare Availability
Healthcare is harder to access in rural Iowa, where residents travel farther for specialist treatment, maternity care, and hospital services.
| Rural Healthcare Measure | Latest Available Figure |
|---|---|
| Rural counties with labor and delivery services | 33 of 77 |
| Women 30+ minutes from a birthing hospital | 14% statewide |
| Critical access hospital beds per 10,000 nonmetro residents | 15.12 |
| All hospital beds per 10,000 residents | 26.03 statewide |
| Dentists per 10,000 residents | 7.59 statewide |
Schools and Colleges in Iowa
Iowa's public schools have improved graduation and attendance.
Best-Rated School Districts
These five districts lead Niche's latest 2027 Iowa school district rankings.
| Rank | District | Niche Grade | Students |
|---|---|---|---|
| #1 | MOC-Floyd Valley Community School District | A+ | 1,555 |
| #2 | Pleasant Valley Community School District | A+ | 5,824 |
| #3 | Treynor Community School District | A | 817 |
| #4 | Gilbert Community School District | A | 1,682 |
| #5 | Van Meter Community School District | A | 1,146 |
Iowa Colleges and Universities
Iowa has three public universities, along with private colleges, community colleges, and technical schools.
| University | Location | Known For |
|---|---|---|
| University of Iowa | Iowa City | Medicine, creative writing, healthcare research |
| Iowa State University | Ames | Engineering, agriculture, veterinary medicine |
| University of Northern Iowa | Cedar Falls | Teacher education, business, accounting |
| Drake University | Des Moines | Law, pharmacy, business |
| Grinnell College | Grinnell | Liberal arts, sciences, undergraduate research |
Transportation and Commuting in Iowa
Iowa has a well-connected highway network, and most residents use their own cars for work and everyday travel.
| Transportation Area | Iowa Data |
|---|---|
| Main interstates | I-29, I-35, I-74, I-80, I-235, I-380, I-480, I-680, I-880 |
| Public transportation | DART in Des Moines, Coralville Transit, CAMBUS in Iowa City, and regional transit services |
| Walking and cycling | More practical near downtown neighborhoods, college campuses, and established trails |
| Busiest airport | Des Moines International Airport (DSM) |
| Level 2 charging ports | 823 |
| DC fast-charging ports | 608 |
Do You Need a Car in Iowa?
Yes, a personal vehicle is the best choice for most Iowa residents. Public buses and regional transit serve certain communities, but they don't reach every neighborhood or rural area.
Is Iowa Right for Your Situation?
Moving to Iowa With a Family
Yes, Iowa is a good choice for families seeking affordable homes, public schools, and space for children.
Moving to Iowa as a Young Professional
Yes, Iowa suits young professionals working in insurance, healthcare, manufacturing, and agricultural technology. Compare job offers, career growth, and take-home pay after housing and transportation expenses.
Moving to Iowa as a Single Person
Yes, Iowa suits singles who enjoy outdoor activities, local festivals, and quieter communities.
Moving to Iowa for Retirement
Yes, Iowa offers retirees a tax advantage through exemptions for Social Security and qualifying retirement income. Property taxes, winter heating, and access to healthcare still deserve attention.
Moving to Iowa for College
Yes, Iowa has three public universities, 15 community college districts, and private colleges offering academic and career-focused programs.
How Much Does It Cost to Move to Iowa?
A move to Iowa from another state costs $2,020 to $7,850 for a 2–3-bedroom home with full-service movers, based on recent interstate moving quotes.
Your starting state, moving distance, household size, and additional services determine the final cost.
Estimated Moving Costs to Iowa
- Nearby State $2,020–$5,710Nebraska to IowaAbout 398 miles
- Mid-Distance Move $2,690–$6,610Texas to IowaAbout 918 miles
- Cross-Country Move $3,640–$7,850California to IowaAbout 1,849 miles
Moving Costs by Service Type
Full-service movers handle the heavy lifting and transportation, while rental trucks and moving containers leave more work to you. Labor-only movers provide help with loading and unloading without transporting your belongings.
| Moving Service | Estimated Cost | What You're Paying For | Detailed Cost Guide |
|---|---|---|---|
| Full-Service Movers | $2,020–$7,850 | Loading, transportation, and unloading | Full-Service Moving Costs |
| Moving Containers | $1,360–$4,690 | Container delivery and transport; you handle loading | Moving Container Costs |
| Rental Trucks | $567–$2,360 | Truck rental; fuel and driving expenses are extra | Moving Truck Rental Costs |
| Labor-Only Movers | $498–$2,418 | Loading and unloading; no truck included | Labor-Only Moving Costs |
Moving Cost to Iowa From Your State
Pick the state you're moving from to see what a 2–3-bedroom move to Iowa usually costs.
Note: These costs are estimates for moving a 2–3-bedroom home to Iowa. Actual prices depend on your location, moving date, and services. Full-service, container, and truck rental costs are estimates, not final quotes. Labor-only rates are hourly for two movers and don't include transportation.
See moving costs from all 40 states
| Moving Route | Distance (Miles) | Full-Service Movers | Moving Container | Truck Rental | Labor-Only (2 Movers/Hour) |
|---|---|---|---|---|---|
| Alabama to Iowa | 830 | $5,467 | $2,386 | $1,519 | $148/hr |
| Arizona to Iowa | 1,390 | $7,432 | $3,151 | $2,477 | $140/hr |
| Arkansas to Iowa | 550 | $4,489 | $2,009 | $1,038 | $154/hr |
| California to Iowa | 1,730 | $8,626 | $3,611 | $3,059 | $146/hr |
| Colorado to Iowa | 770 | $5,261 | $2,309 | $1,418 | $154/hr |
| Connecticut to Iowa | 1,210 | $6,804 | $2,904 | $2,169 | $148/hr |
| Delaware to Iowa | 1,090 | $6,377 | $2,741 | $1,962 | $150/hr |
| Florida to Iowa | 1,360 | $7,326 | $3,108 | $2,424 | $138/hr |
| Georgia to Iowa | 900 | $5,716 | $2,483 | $1,641 | $139/hr |
| Idaho to Iowa | 1,320 | $7,188 | $3,056 | $2,356 | $164/hr |
| Illinois to Iowa | 290 | $3,579 | $1,656 | $596 | $154/hr |
| Indiana to Iowa | 440 | $4,101 | $1,859 | $856 | $148/hr |
| Kansas to Iowa | 350 | $3,786 | $1,738 | $702 | $144/hr |
| Kentucky to Iowa | 580 | $4,591 | $2,047 | $1,096 | $153/hr |
| Louisiana to Iowa | 910 | $5,756 | $2,498 | $1,659 | $157/hr |
| Maine to Iowa | 1,380 | $7,398 | $3,142 | $2,457 | $176/hr |
| Maryland to Iowa | 1,020 | $6,133 | $2,648 | $1,847 | $148/hr |
| Massachusetts to Iowa | 1,300 | $7,116 | $3,031 | $2,323 | $158/hr |
| Michigan to Iowa | 530 | $4,417 | $1,981 | $1,006 | $146/hr |
| Minnesota to Iowa | 260 | $3,473 | $1,612 | $548 | $162/hr |
| Mississippi to Iowa | 790 | $5,328 | $2,338 | $1,452 | $156/hr |
| Missouri to Iowa | 290 | $3,579 | $1,656 | $596 | $152/hr |
| Montana to Iowa | 1,120 | $6,488 | $2,783 | $2,016 | $187/hr |
| Nebraska to Iowa | 260 | $3,473 | $1,612 | $548 | $166/hr |
| Nevada to Iowa | 1,490 | $7,787 | $3,287 | $2,646 | $140/hr |
| New Hampshire to Iowa | 1,290 | $7,082 | $3,016 | $2,303 | $163/hr |
| New Jersey to Iowa | 1,140 | $6,561 | $2,808 | $2,048 | $150/hr |
| New Mexico to Iowa | 1,030 | $6,171 | $2,662 | $1,861 | $158/hr |
| New York to Iowa | 1,110 | $6,449 | $2,774 | $2,001 | $157/hr |
| North Carolina to Iowa | 990 | $6,033 | $2,609 | $1,794 | $147/hr |
| North Dakota to Iowa | 570 | $4,556 | $2,038 | $1,082 | $191/hr |
| Ohio to Iowa | 630 | $4,772 | $2,116 | $1,183 | $146/hr |
| Oklahoma to Iowa | 570 | $4,556 | $2,038 | $1,082 | $138/hr |
| Oregon to Iowa | 1,740 | $8,659 | $3,626 | $3,073 | $146/hr |
| Pennsylvania to Iowa | 980 | $5,999 | $2,596 | $1,779 | $153/hr |
| South Carolina to Iowa | 1,000 | $6,071 | $2,619 | $1,813 | $142/hr |
| South Dakota to Iowa | 390 | $3,923 | $1,791 | $769 | $174/hr |
| Tennessee to Iowa | 650 | $4,834 | $2,144 | $1,217 | $145/hr |
| Texas to Iowa | 930 | $5,817 | $2,527 | $1,693 | $136/hr |
| Utah to Iowa | 1,160 | $6,627 | $2,842 | $2,082 | $154/hr |
Get a Moving Estimate for Your New Home in Iowa
Use our Moving Cost Calculator to enter your moving details and get a more specific estimate.
Best Moving Companies for Your Move to Iowa
A good moving company should offer fair prices, handle your belongings safely, and deliver them on time. Some Iowa moving companies only handle local moves, while others cover long-distance routes, so check this before booking.
Get quotes from different companies and compare movers by price, services, and reviews. Also include insurance, extra fees, payment terms, and cancellation rules in your mover selection checklist before signing.
You should also account for packing, paperwork, and pickup dates in your long-distance moving checklist. The companies below are worth considering for your move to Iowa.
Top picks for you
View all ↗


Find Movers for Your Move to Iowa From Another State
When Is the Best Time to Move to Iowa?
The best time to move to Iowa is late spring or early fall, when temperatures are milder, and roads are generally easier to travel. Once you choose a season, plan your moving timeline to keep everything on schedule.
Best Day and Time for Moving
Tuesday through Thursday are good days to move in Iowa because movers are usually less busy. An early morning start also gives you more time to load and unload before dark.
FAQs
Our Research and Data Process
We created this guide to answer the common questions people have before moving to Iowa. Most of the information comes from government agencies, official public records, and other primary sources. For information that changes more frequently, such as rent, home prices, insurance costs, and moving costs, we also use reliable first-party institutions and established market-data sources to provide the latest available information.
Data Sources Used
We prioritize primary and official sources whenever reliable data is available.
| Source Type | Approx. Share Used | Main Data Covered |
|---|---|---|
| Federal government sources | 46% | Population, employment, income, economic conditions, crime, weather, natural hazards, transportation, migration, energy, and road safety |
| State and local government sources | 26% | Taxes, schools, licensing, transportation, healthcare, public safety, and state-specific regulations |
| First-party institutions and market sources | 18% | Housing, rent, insurance, hospitals, universities, utilities, and moving costs |
| Reputable secondary sources | 10% | Rankings, comparisons, and supporting market context |
- Our public data sources commonly include: U.S. Census Bureau, U.S. Bureau of Labor Statistics, U.S. Bureau of Economic Analysis, FBI Crime Data Explorer, Federal Emergency Management Agency (FEMA), National Oceanic and Atmospheric Administration (NOAA), National Weather Service, National Highway Traffic Safety Administration (NHTSA), Federal Highway Administration (FHWA), and U.S. Energy Information Administration (EIA).
- For state-specific information, we use the Iowa state agencies, county and city governments, public school systems, transportation authorities, public universities, and other official local institutions. Official state and local government websites can also be located through the USA.gov state and local government directory. USAGov
- For local public transportation data, we also use individual transit authorities and the Federal Transit Administration's National Transit Database, which provides profiles for reporting transit agencies across the country.
How Data Was Compared
We make comparisons using the same source, time period, geographic level, and measurement method whenever possible. When a useful figure is not published directly, we calculate it from the underlying data. For example:
- Population growth = percentage change between two comparable population estimates
- Cost difference = state or city value compared with the relevant U.S. benchmark
- Tax difference = percentage-point or percentage difference between locations
- Crime rate = reported offenses adjusted for population
- Employment change = change in employment between comparable reporting periods
- Monthly cost = annual cost divided by 12 when only an annual figure is published
How Cities and Communities Were Evaluated
We do not evaluate cities based on a single statistic. Instead, we consider several factors that matter when choosing where to live:
| Factor | Weight |
|---|---|
| Jobs & income | 25% |
| Housing & living costs | 20% |
| Crime & safety | 20% |
| Schools & family needs | 15% |
| Healthcare | 10% |
| Transportation | 5% |
| Lifestyle & recreation | 5% |
How Local Experience Was Collected
We do not present invented firsthand experience as fact. Local context comes from official city and county governments, school districts, transportation agencies, hospitals, universities, economic-development organizations, public services, and resident-facing market data.
How Facts Were Checked
We check the latest available information before adding important statistics to a guide. For major topics such as population, employment, taxes, crime, education, transportation, weather, and public safety, we prioritize government agencies and other primary sources.
We also check repeated statistics throughout the guide so that the same metric uses the same value, year, definition, and source wherever it appears.
If two figures measure different things, such as median home value and typical home value, they are labeled separately rather than treated as the same statistic.
Data Limitations
Not every dataset updates at the same time. A 2026 article may still contain the latest official 2024 or 2025 data when that is the newest release available.
Market figures such as rent, home prices, insurance, and mover costs can also change faster than government statistics. These numbers should be treated as current benchmarks rather than guaranteed prices.